Multiplot it!
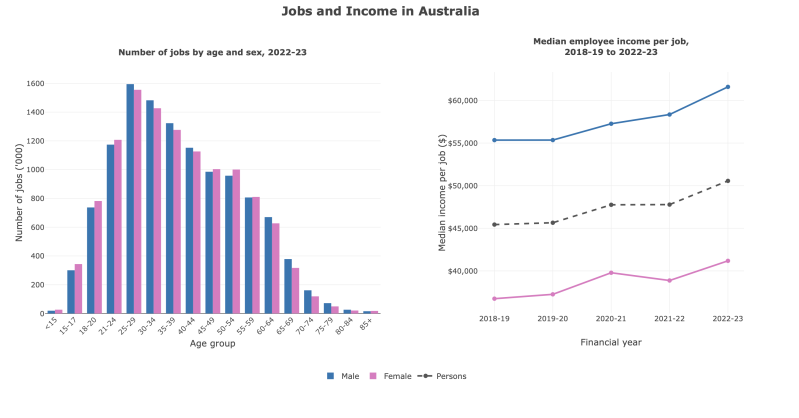
This is an example of a combined data plot. Showing juxtaposition between variables in the two different charts. This comparison shows the complementary, but different contrast between 'Number of jobs by age and sex in 2022-2023', and 'the median employee income per job in 2018- 2023.' This multiplot design was created using R studio, to combine the data from the Australian Beruau of statistics to combine both sets of data, side by side.
Link to interactive plot - file:///Users/ejazrumboll/hello.html
Data Card:
Title
Jobs and income within Australia
Summary
This is a combined plot containing data from the Australian Bureau of statistics. The left visualisation is a grouped bar chart of the number of jobs held in Australia in 2022-23 (in thousands), by 17 age groups, with male and female bars side by side. Jobs rise sharply through the late teens and early twenties, peak at ages 25–29 (about 1.59 million male and 1.56 million female jobs), then decline steadily with age, falling below 100,000 per sex from age 75. Women held slightly more jobs than men in the youngest groups (under 25) and in the 45–59 groups; men held more in the 25–44 and 60+ groups. The right visualisation is a line chart of median annual employee income per job from 2018-19 to 2022-23 for males, females and all persons. All three rose over the time period, persons from $45,435 to $50,561, males from $55,343 to $61,589, and females from $36,743 to $41,182. Male median income was approximately $20,000 higher than female median income every year, and female income decreased slightly in 2021-22 before rising again.
Data sources
Greene, D. (2022). Jobs in Australia, 2022-23. Australian Bureau of Statistics. https://www.abs.gov.au/statistics/labour/jobs/jobs-australia/2022-23
Mapping
Bar chart:
X axis -Age group in years, 17 groups (15, 15–17, 18–20, 21–24, 25–29, 30–34, 35–39, 40–44, 45–49, 50–54, 55–59, 60–64, 65–69, 70–74, 75–79, 80–84, 85+)
Y axis -Number of jobs ('000) held during 2022-23
Bar colour - blue = males, pink = females
Line graph:
X axis - Financial year (1 July – 30 June), five periods (2018-19, 2019-20, 2020-21, 2021-22, 2022-23)
Y axis - Median employee income per job (Australian dollars per year)
Line colour - pink = female, blue = male, grey = persons
Important notes
The visualisation containing data of 'the median employee income per job' has data values from 2018 to 2023, whereas the visualisation ' number of jobs by age and sex' only contains data from 2023
The bars count jobs, not workers. One person can hold several jobs in a year, either at the same time or one after another, so 23.6 million jobs were held by 15.5 million employed people.
The left Visualisation includes all jobs, while the right Visualisation covers employee jobs only.
The income y-axis starts at about $35,000, not zero, which makes yearly changes look larger than they are
Access
You can access the original source of data from the table here -
Greene, D. (2022). Jobs in Australia, 2022-23. Australian Bureau of Statistics. https://www.abs.gov.au/statistics/labour/jobs/jobs-australia/2022-23 - https://www.abs.gov.au/statistics/labour/jobs/jobs-australia/2022-23