Make It Interactive!
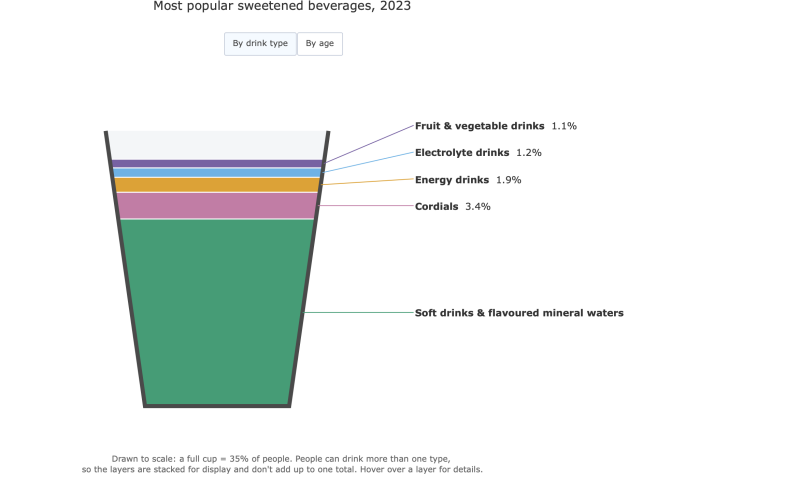
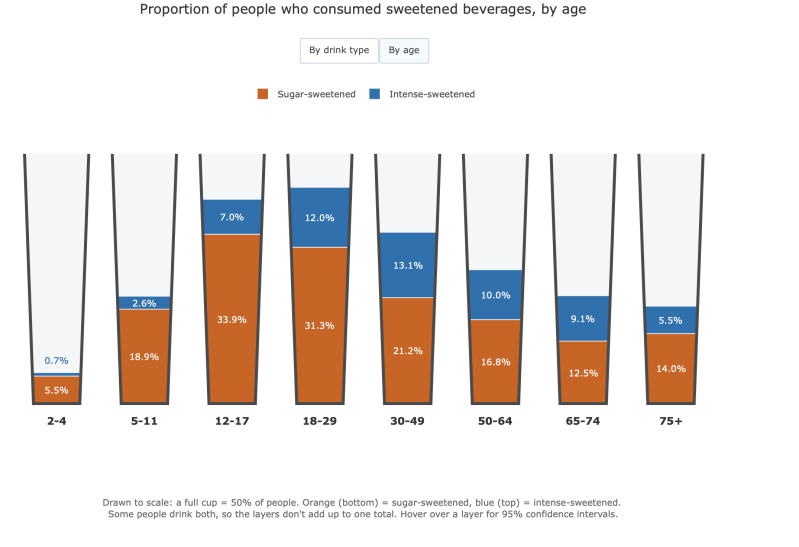
This is an example of and interactive data visualisation made from R studio, using data sourced from the Australian Bureau of statistics 'proportion of people who consumed sweetened beverages, by age, and the most popular beverages, in 2023. The variables being studied are, drink type, age group, type of sweetner used, and percentage of individuals that drink sweetened beverages. The visualisation was made interactive in order to reduce visual overload, so viewers can only see the results when they hover over the section. This also allows the viewer to easily engage when reading the visualisation, and easily interpret results.
file:///Users/ejazrumboll/Untitled.html - Link to interactive plot
Data Card:
Title
Proportion of people who consumed sweetened beverages by age, and type of sweetener in 2023
Summary
The left data visualisation represents a singular stacked cup chart showing the proportion of Australians aged 2+ who drank each type of sweetened beverage on the survey day in 2023 (a full cup = 35% of people). Soft drinks and flavoured mineral waters were by far the most common (23.8%), followed by cordials (3.4%), energy drinks (1.9%), electrolyte drinks (1.2%) and fruit and vegetable drinks (1.1%). The right Visualisation shows eight cups, one per age group (a full cup = 50% of people), each split into a sugar sweetened layer (orange and at the bottom) and an intense sweetened layer (blue, at the top). Sugar sweetened drinks increase through childhood ages, and are at the highest amongst 12–17 year olds (33.9%) and 18–29 year olds (31.3%), then moderately decrease with age, as people aged 65 and over, only consume (14%). Intense sweetened drinks peak later, among 30–49 year olds (13.1%) and 18–29 year olds (12.0%), which are the highest percentages, and are significantly lower amongst 2–4 year olds (0.7%).
Data Sources
Australian Bureau of Statistics. (2023, December 14). National, state and territory population, june 2023 | Australian Bureau of Statistics. Www.Abs.Gov.Au. https://www.abs.gov.au/statistics/people/population/national-state-and-territory-population/jun-2023
PatternUniverse.com. (n.d.). Printable shot glass template. PatternUniverse.Com. Retrieved 27 October 2026, from https://patternuniverse.com/download/shot-glass-pattern/
Mapping
Most popular bevarages:
Layer colour and label - Beverage type, five categories (Soft drinks & flavoured mineral waters (green), Cordials (pink), Energy drinks (yellow), Electrolyte drinks (light blue), Fruit & vegetable drinks (purple))
Layer height - Proportion of people aged 2+ who consumed that beverage type (% of population; full cup = 35%)
People who consume sweetened drinks by age:
X-axis - Age group in years, eight groups (2–4, 5–11, 12–17, 18–29, 30–49, 50–64, 65–74, 75+)
Layer height - Proportion of the age group who consumed that sweetener type (% of age group; full cup = 50%)
Layer colour - Sweetener type - 2 categories, (Sugar sweetened (orange, bottom), Intense sweetened (blue, top))
Important notes
This set of data only contains results from 2023 - other years results may be different.
Layers are not additive - People can drink more than one type, so the layers overlap. They are stacked for display only. Adding them up overstates consumption. For example, total sweetened-beverage consumption was 28.9%, not the 31.5% you’d get by summing the drink-type layers.
Results may be Bias - results are recorded from people remembering what drinks they have consumed - some individuals may be unable to fully remeber their exact drink consumption.
Overall, the total Average daily consumption of sweetened beverages was 159mL, 109mL of sugar sweetened , 49mL of intense sweetened
Access
You can also access the original data source from the table in the ABS website - https://www.abs.gov.au/statistics/health/food-and-nutrition/sweetened-beverages/2023