If the world economy were the solar system
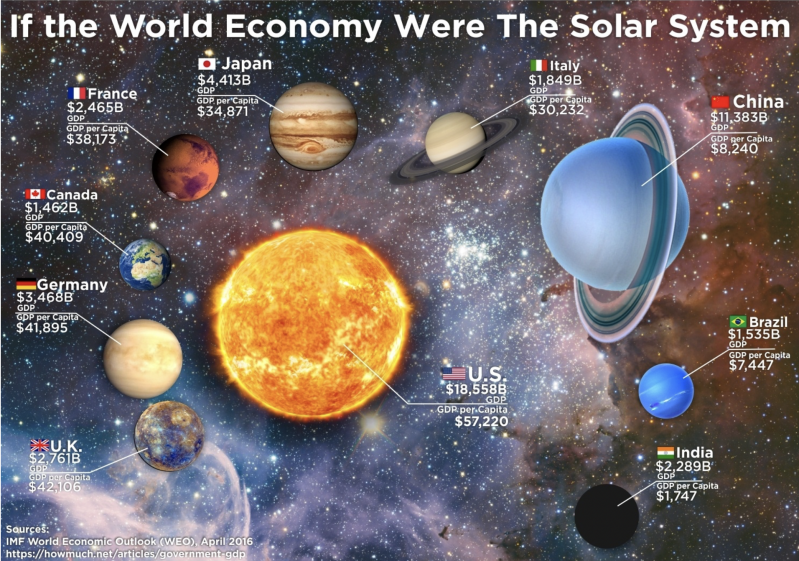
This data visualisation (If the World Economy Were the Solar System. (2016). Irena Martinčević ‘If the World Economy Were the Solar System’. November 15th, (2016). Howmuch.Net. https://howmuch.net/articles/solar-system-economy displays the world's major economies as planets in the solar system. The size of each planet represents the size of the countries total GDP.
Data is originated from - International Monetary Fund.April 2016. (2016, April 12). World Economic Outlook Database. https://www.imf.org/en/Publications/WEO/weo-database/2016/April
Variables:
Qualitative - The nominal/categorical variable of different countries is represented each planet in the solar system.
Quantitative - The ratio variable of income is represented by planet size, the larger size of planet means the greater income
GDP ($) and GDP per capita: The U.S is represented as the sun as it is the largest economy, having the highest per capita of income, being $57,000 per annum. The other nine planets represent the following greatest economies in the world. The smaller distance means greater GDP per capita. As the UK, being mercury, having the shortest distance from the sun, meaning it is the second biggest economy with $42,106 per annum. Whilst India, being the furthest from the sun, meaning it has the lowest GDP per capita in this visualisation of $1,747 per annum. Planet size is another variable shown in this visualisation, as it reflects the overall GDP. China, represented by Uranus, is the 7th planet, as well as the 7th largest economy after the US. With a GDP per capita of $8,240 per annum. However, it is the second largest in size due to its size of total GDP ($11,383B), but a large population. Followed by Japan being 3rd, and Brazil being the smallest. Uranus is closer than planet nine, due to Brazil's per captia income being higher, but the planet size is smaller due to Indias total GDP being higher.
Data and Question Alignment
This data set (GDP and GDP per captia) is not entirely lined well with the question being how these economies compare in size. The planet size reflects the actual size of the planets, instead of the size of the GDP. Even though the data is displayed from the highest value being represented by the largest planet, and the lowest value being represented by the smallest planet. Although the data visualisation is aesthetic and creative, the scaling could mislead viewers. The visualisation of data also is not very specific, meaning the visual alignment and the data visualisation is not accurate.
Verification discussion
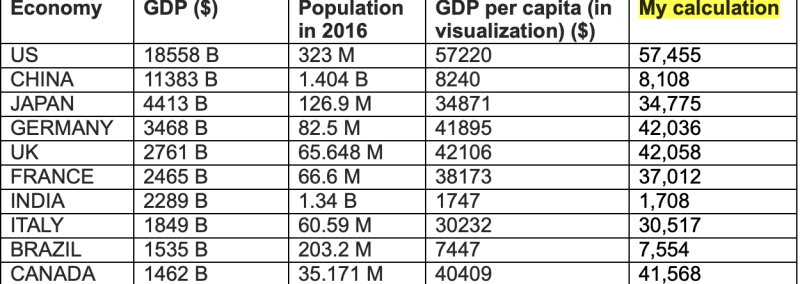
The numbers might not totally align as populations statistics may vary from different sources. Other than that, my calculations are pretty similar to the data presented on visualization, therefore it can be determined that the data is reliable.
Each variable forms a column, and each observation forms a row in this table
From analyzing the populations of each economy in 2016, these calculations of the GDP (GDP= GDP/Population) is roughly verified as the values calculated are like the values in the data visualization.
GDP per capita = GDP/Population
Data is collected from: International Monetary Fund.April 2016. (2016, April 12). World Economic Outlook Database. https://www.imf.org/en/Publications/WEO/weo-database/2016/April
And the population of countries in 2016 - Countries by Population 2016. (2016). PopulationPyramid.Net. https://www.populationpyramid.net/population-size-per-country/2016/
Quality examination:
The data sourced from the international monetary fund is reputable, as it is a widely used data source across the world. The data is believed to be sourced by member governments and central banks, and it's the standard reference used worldwide by governments, universities, and other institutions for GDP, inflation, and other macroeconomic indicators. However, the population data from the Population pyramid may not be reputable as the data is secondary from another source. The website is also a clickbait website, meaning they may prioritise maximising ad revenue through exaggerated or misleading headlines over factual accuracy and transparency.
25/08/2026